Keras + TensorFlow:用 CNN 辨識中文手寫數字
TensorFlow 正夯,大家都在寫機器學習;這學期修了一門人工智慧的課,期末是要我們用 Keras + TensorFlow 弄出辨識中文數字的模組。
至於為什麼不是用 tf.js 而是用 Python,沒辦法,還是得拿學分。
收集資料
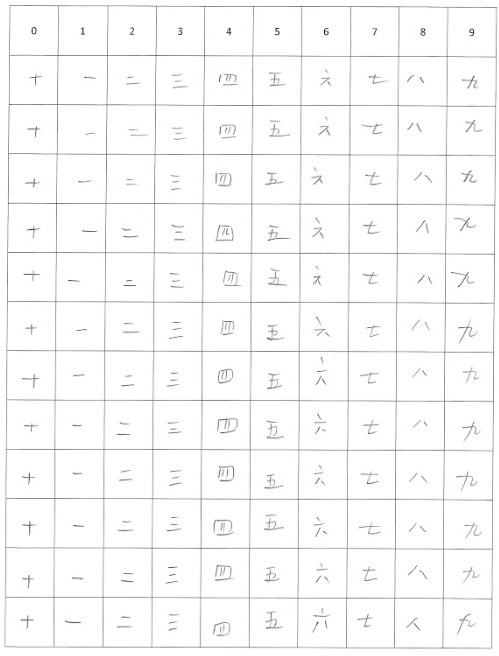
原本我們是用 MNIST 的資料集做了一次 MLP 跟 CNN,但期末作業是要用中文手寫字。我們不知道哪裡有中文手寫字,所以由強者我學長印出了 150 張的 A4 紙,上面有格子讓大家寫滿數字的一二三四五六七八九十。我們花了一節課寫這些東西,就像回到國小時光。
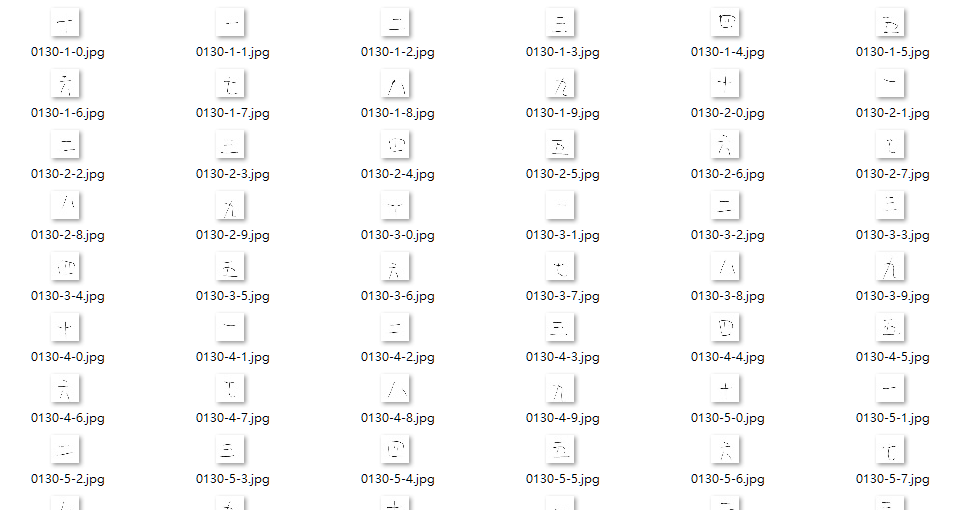
然後再由強者我朋友,用了一些什麼 Python + OpenCV 套件,還是手動切出來我也不太清楚,最後弄出了將近兩萬張的 28x28 像素的圖片。
環境建置
這學期初我們花了好幾節課在裝環境,先裝什麼 Anaconda 的,然後再裝了一些套件。每次開啟還要 source activate tensorflow 之類的,對於一個 Python 苦手來說真是蠻困難的。
後來發現東西丟到 Google Colab 上超級方便、超級開心、超級好做,之後推薦大家都在 Google Colaboratory 上做,還附贈免費 GPU 加速。剛開始學這種東西光搞懂那些概念就夠難的了,真的不需要花那麼多時間在自己的筆電上等待運算!
資料預處理
首先要下載資料:我們把檔案都包成 zip 檔,之後再透過 urlib2 下載下來、zipfile 解壓縮。
img_url = 'https://....../processed_img.zip' # your file.

import urllib2
import zipfile

print 'Downloading file...'
downloadurl = urllib2.urlopen(img_url);

zipcontent= downloadurl.read()
with open("processed_img.zip", 'wb') as f:
    f.write(zipcontent)
print 'Extracting file...'
with zipfile.ZipFile(open('processed_img.zip')) as f:
    f.extractall('.')
print 'Done.'
!ls # Google Colab 可以直接用 ! 執行 bash 語法。我不怎麼寫 Python,我不太確定什麼環境可以這樣搞。
由於資料是課堂上大家蒐集的,也不太確定能不能公開,這篇就先不把資料集放出來了。
解壓縮後會看到資料夾下有一個 processed_img.zip 和 processed_img 的資料夾,進到資料夾後會看到大約兩萬張圖片。
接著我們要把檔案都讀進來,然後把圖片轉成陣列,讓電腦運算:
import os
import numpy as np
from sklearn.model_selection import train_test_split
from keras.preprocessing import image
from keras.utils import np_utils, plot_model

def load_data():
    path = './processed_img/'
    files = os.listdir(path)
    images = []
    labels = []
    for f in files:
        img_path = path + f
        img = image.load_img(img_path, grayscale=True, target_size=(28, 28))
        img_array = image.img_to_array(img)
        images.append(img_array)

        lb = f.split('-');
        lb = lb[2].split('.jpg')
        lb = lb[0]
        labels.append(lb);

    data = np.array(images)
    labels = np.array(labels)

    return data, labels

print 'Loading data...'
images, lables = load_data()
images /= 255
(x_train, x_test, y_train, y_test) = train_test_split(images, lables, test_size=0.2)
y_train_onehot = np_utils.to_categorical(y_train)
y_test_onehot = np_utils.to_categorical(y_test)
稍微解釋下,我們先把檔案透過 image.load_img 讀進來,由於圖片是灰階的,所以加上 grayscale=True,然後 target_size 指定圖片大小。
lb 到 labels 的部分是在處理圖片標籤。剛剛提到強者我朋友已經把圖片都整理完,而且用 張數-列-標籤.jpg 的方式命名。所以我們只要取出 標籤,就能當作標籤來用。
之後用 sklearn 套件裡的 train_test_split 方法把資料集切成訓練資料集和測試資料集。
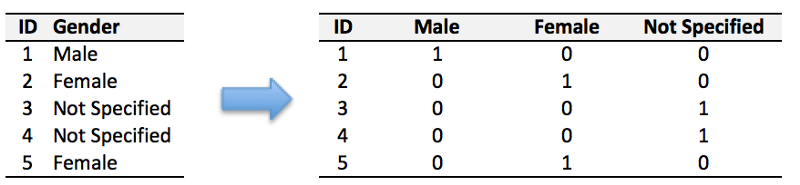
最後 np_utils.to_categorical 則是要把標籤處理成 One-hot 格式。
One-hot 是什麼?有興趣可以去看 Yeh James 的 資料分析&機器學習 第2.4講:資料前處理(Missing data, One-hot encoding, Feature Scaling)。這裡借用他示意圖帶過:
模型建置
由於是圖片分類,這邊選用卷積層模型(CNN)來做。
from keras.models import Sequential, model_from_yaml, load_model
from keras.layers import Dense, Conv2D, Flatten, Dropout, MaxPooling2D
from keras.optimizers import Adam, SGD
model = Sequential()
model.add(Conv2D(filters=16, kernel_size=(5, 5), padding='same', input_shape=(28, 28, 1), activation='relu'))
model.add(MaxPooling2D(pool_size=(2, 2)))
model.add(Dropout(0.25))
model.add(Conv2D(filters=36, kernel_size=(5, 5), padding='same', activation='relu'))
model.add(MaxPooling2D(pool_size=(2, 2)))
model.add(Dropout(0.5))
model.add(Flatten())
model.add(Dense(10, activation='softmax'))
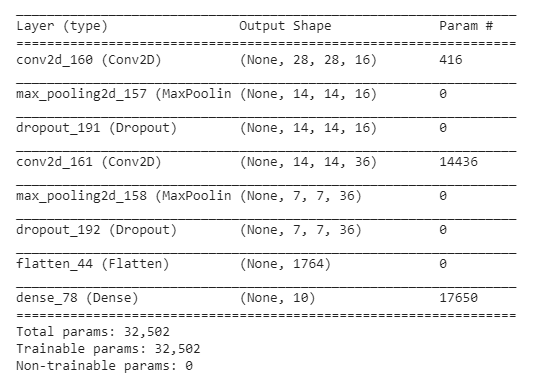
model.summary()
中間加入
Dropout層是防止 Overfitting,其他部分這邊就不多講為什麼要這樣建立模型。如果對 CNN 模型建立有興趣,可以看看不久前翻譯的 圖像訓練:使用卷積神經網路辨識手寫數字,如果覺得哪裡翻的怪怪的歡迎發 PR XD。
接著用 model.summary 印出模型的摘要:
訓練模型
接著要定義優化器和損失函數,這裡使用傳說中很好用的 Adam 和 binary_crossentropy,並定義評估指標 accuracy。
sgd = Adam(lr=0.0003)
model.compile(loss='binary_crossentropy',optimizer=sgd, metrics=['accuracy'])
想知道優化器和損失函數是什麼的話,也可以看看這篇 訓練的第一步:從合成數據中訓練曲線。
最後把我們剛剛預處理完的資料都丟進去:
train_history = model.fit(x_train, y_train_onehot, batch_size=200, epochs=50, verbose=2, validation_data=(x_test, y_test_onehot))
查看訓練結果
剛剛我們有將訓練過程存到 train_history 裡面,現在我們可以用 matplotlib 將它繪製成圖表:
import matplotlib.pyplot as plt
def show_train_history(train_history, title, train, validation):
plt.plot(train_history.history[train])
plt.plot(train_history.history[validation])
plt.title(title)
plt.ylabel(train)
plt.xlabel('Epoch')
plt.legend(['train', 'validation'], loc = 'upper left')
plt.show()
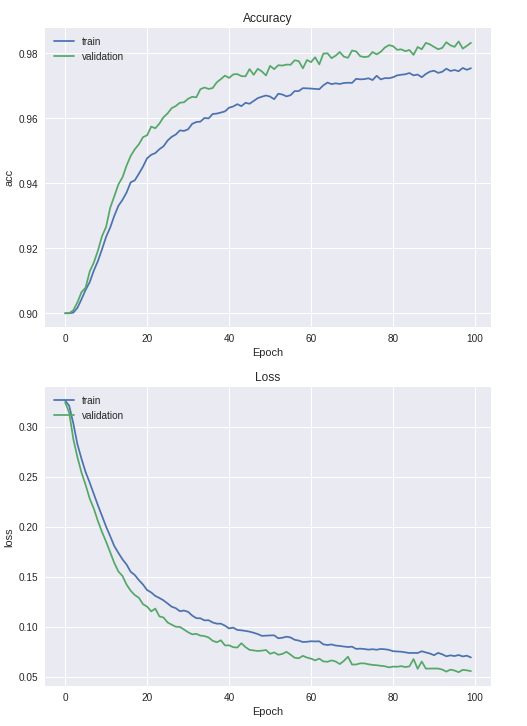
show_train_history(train_history, 'Accuracy', 'acc', 'val_acc')
show_train_history(train_history, 'Loss', 'loss', 'val_loss')
可以看到訓練狀況:
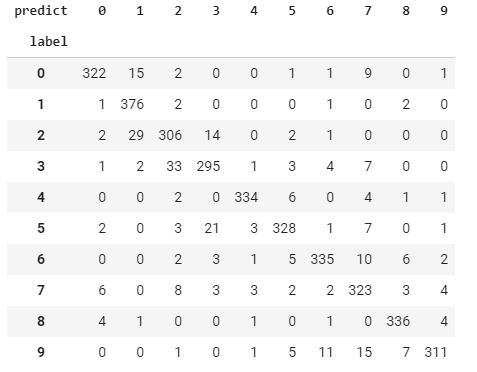
也可以用 pandas 的 crosstable 畫成混淆矩陣:
import pandas as pd
prediction = model.predict_classes(x_test)
pd.crosstab(y_test, prediction, rownames=['label'], colnames=['predict'])
訓練狀況應該還不錯?看起來原本 label 是 9 的樣本預測錯的最多。